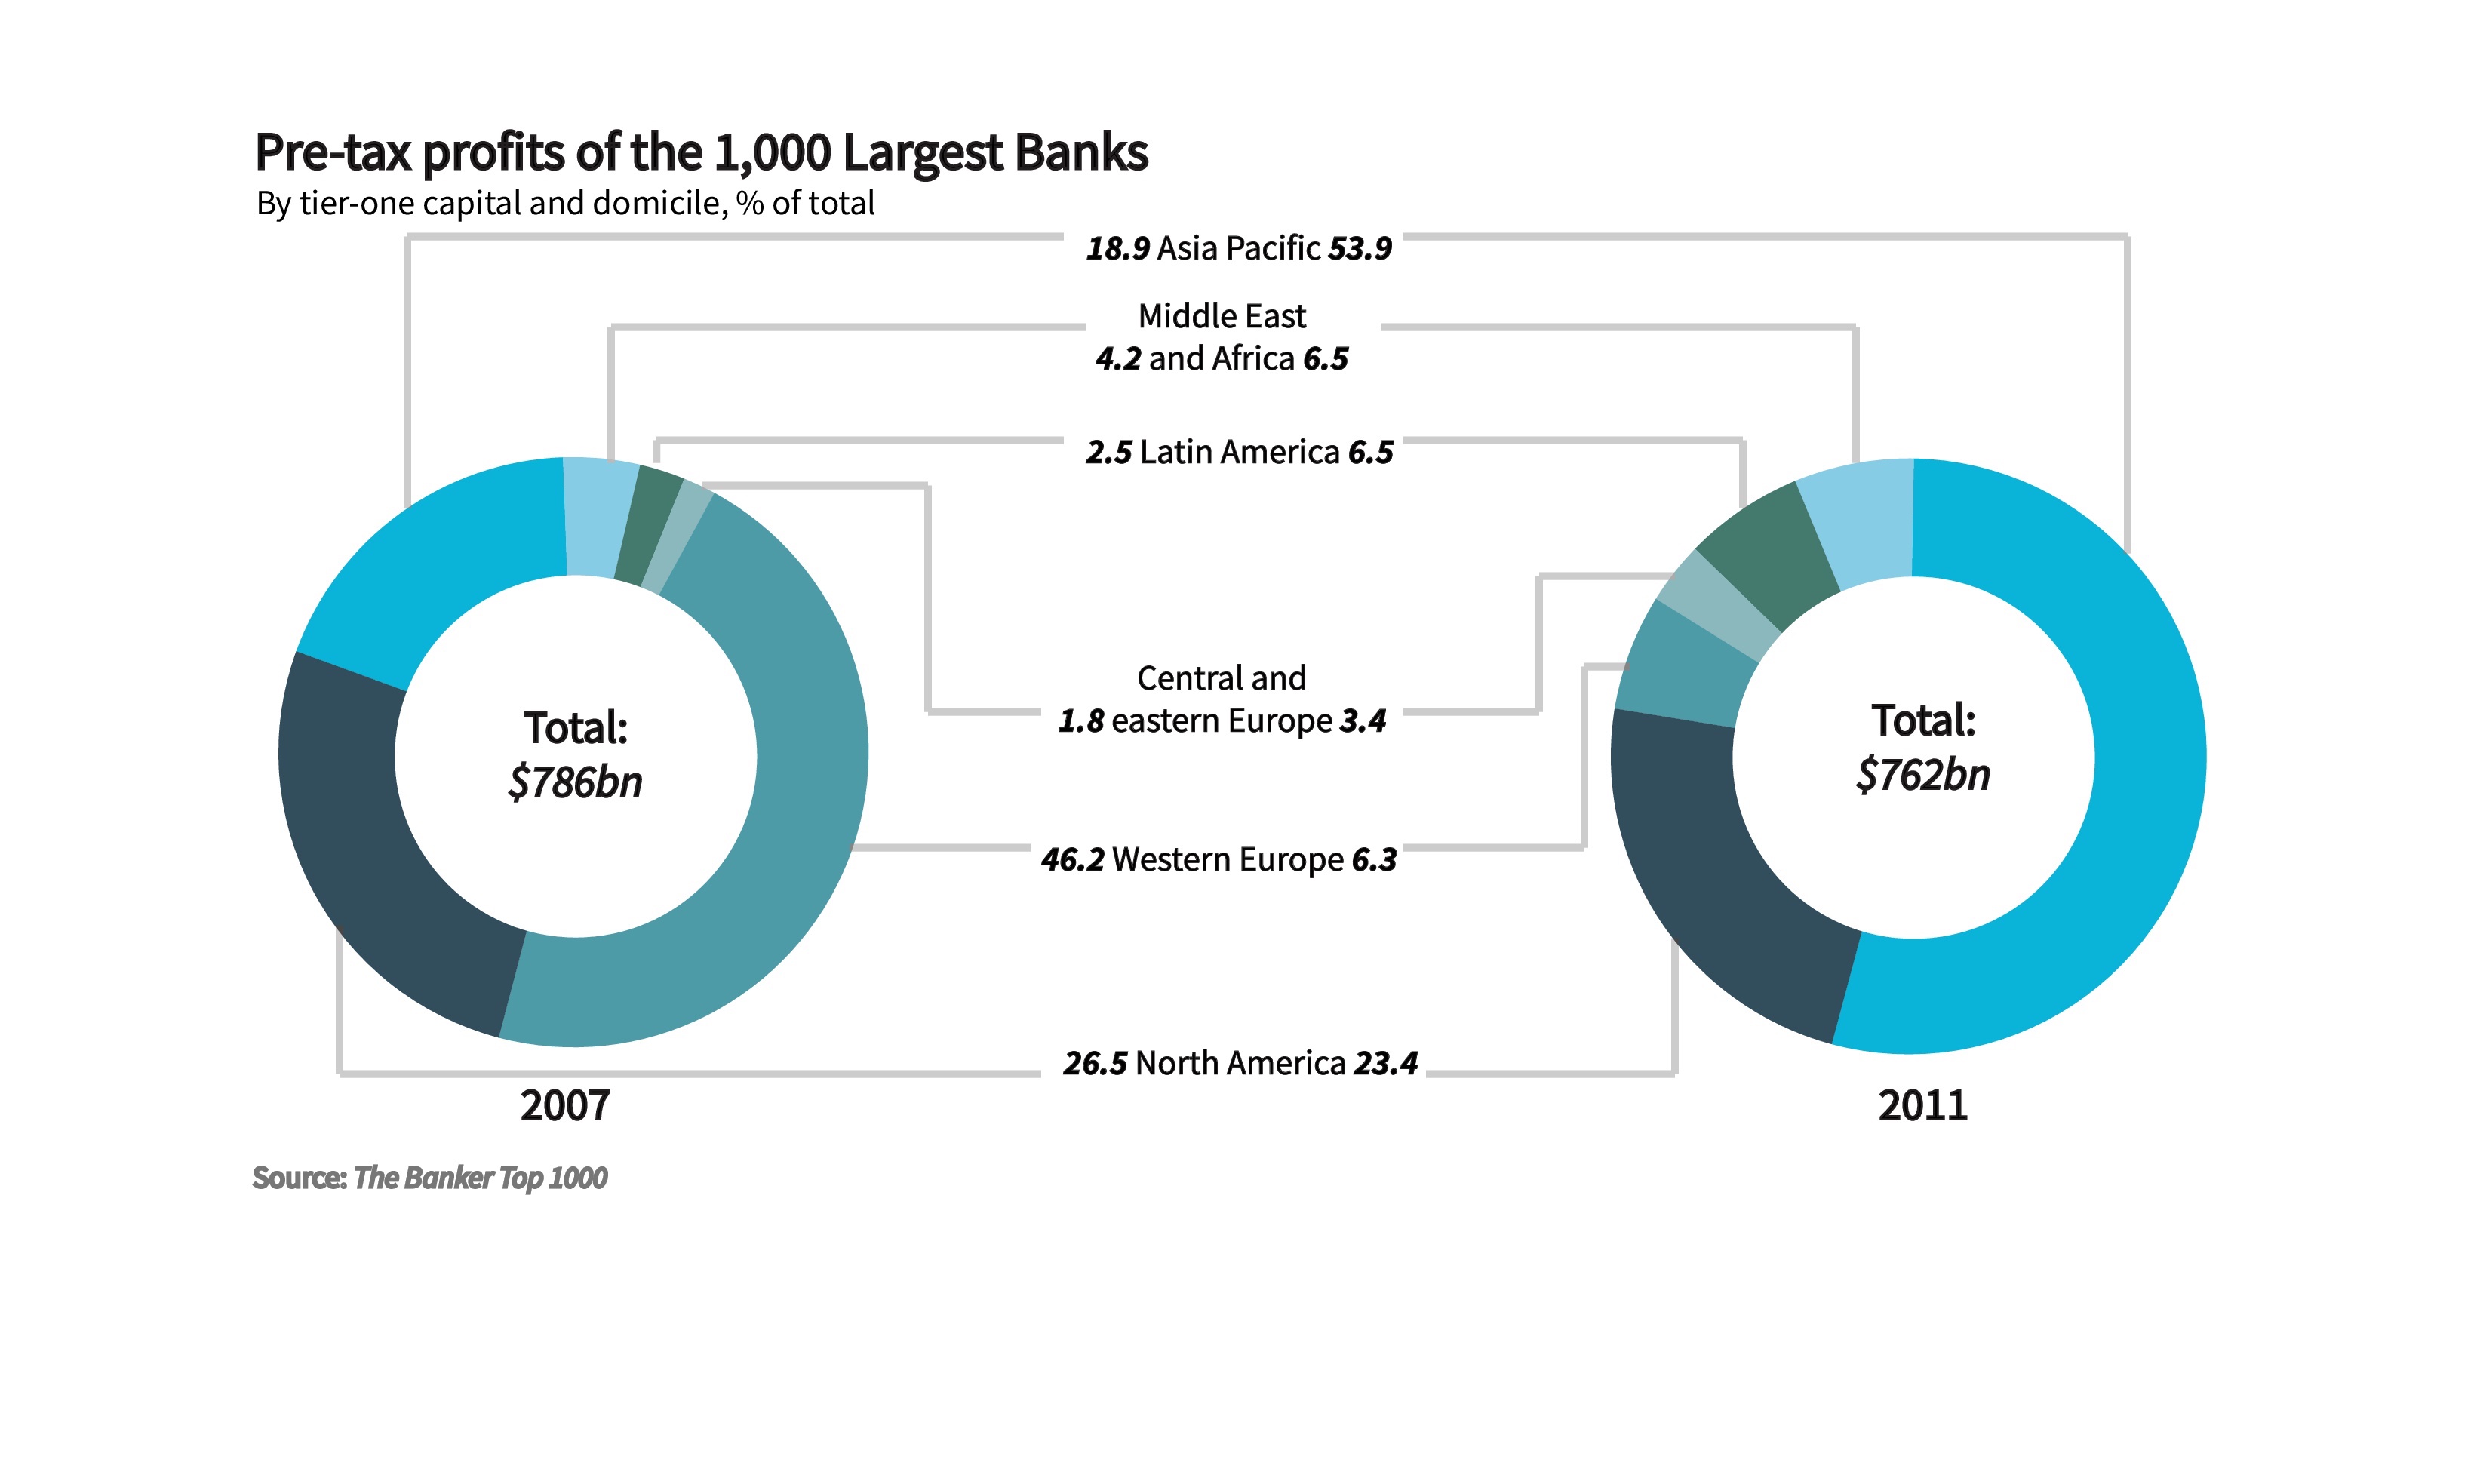
Eastern Shift in Global Bank Profits
Replicating The Economist's "donut chart" visualization from its July 2012 piece on Asian banks increasing their share of global bank profits from 2007 to 2011.
Visualization performed in Python using Matplotlib; tweaks made using Adobe Illustrator.
